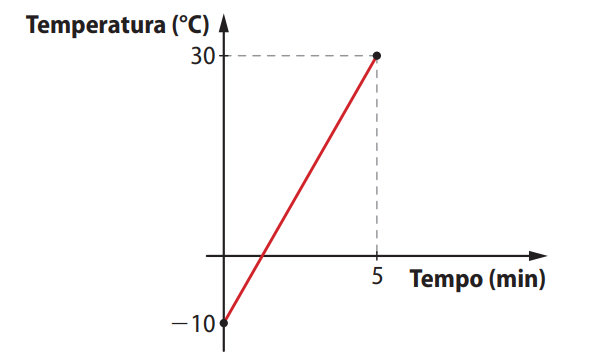
Questão 43. Uma barra de metal com temperatura inicial de −10 °C foi aquecida até 30 °C. O gráfico a seguir representa a temperatura da barra em função do tempo.
a) Quanto tempo após o início da experiência a temperatura atingiu 0 °C?
b) Em qual intervalo de tempo a temperatura da barra ficou positiva? E negativa?
🔍 Ver solução passo a passo
🔎 Entendendo o enunciado:
A temperatura sobe linearmente de -10 °C para 30 °C entre 0 e 5 minutos. A função que representa esse crescimento é uma função afim, e queremos saber quando a temperatura atinge 0 °C (item a) e em quais intervalos ela foi negativa ou positiva (item b).
1) Encontrando a função da reta:
Sabemos que:
- No tempo \( t = 0 \), a temperatura era \( T = -10 \)
- No tempo \( t = 5 \), a temperatura era \( T = 30 \)
Coeficiente angular (taxa de variação):
$$ m = \frac{30 – (-10)}{5 – 0} = \frac{40}{5} = 8 $$
Logo, a função é:
$$ T(t) = 8t – 10 $$
2) Item a – Quando a temperatura atinge 0 °C:
Igualamos \( T(t) = 0 \):
$$ 8t – 10 = 0 \Rightarrow 8t = 10 \Rightarrow t = \frac{10}{8} = 1{,}25 \text{ min} = 1 \text{min} 15 \text{seg} $$
3) Item b – Intervalo de temperatura positiva e negativa:
- Positiva: Quando \( T(t) > 0 \Rightarrow t > 1{,}25 \)
- Negativa: Quando \( T(t) < 0 \Rightarrow t < 1{,}25 \)
Como o experimento vai até \( t = 5 \):
$$ \text{Temperatura positiva: } 1{,}25 < t \leq 5 \\ \text{Temperatura negativa: } 0 \leq t < 1{,}25 $$
✅ Conclusão:
- Tempo para atingir 0 °C: 1min15s
- Temperatura positiva: \( 1{,}25 < t \leq 5 \)
- Temperatura negativa: \( 0 \leq t < 1{,}25 \)